UX Case Study
A Fleet Management App for Telematics Enabled Commercial Vehicles
2020

Designing Experience For Fleet Management & Performance System
Product Overview
An India’s leading automotive company wanted to build an app for the commercial transport owners (having vehicles with and without telematics technology) to revamp and integrate all the fleet managing services which were being offered to the customers through different formats & platforms. The application was set to covers such 30+ odd features under following categories:
1.
Telematics connected monitoring and tracking of the vehicles
2.
Uptime services & management
3.
Performance enhancement
Project Objectives
To design a mobile app and a desktop application that provides intuitive solutions and an easy interface for complex fleet operations involving multiple stakeholders. The application could be used by the fleet owners/ managers/ supervisors having 20+ commercial trucks & buses.
Design Framework

Users
Targeted users for the application are the fleet managers or supervisors of transport companies who have light, medium & heavy duty trucks and buses. In general, a fleet manager has following major responsibilities:
Manage drivers and develop efficient driver schedules to maximise profits.
Monitor & analyse fleet operation in order to maximise profits
Vehicle service and repair management to ensure operational efficiency and to minimise downtime
Work as a catalyst to increase the performance level of vehicles and drivers to ensure maximum productivity.
User Journey Mapping
We interacted with some of the key users of existing services/ apps and compiled their pain-points & thoughts regarding different feature sets they regularly used. With this understanding, the user's journey was crafted and divided into four major steps.

Design Strategy

All key information and features should be navigated from a landing page. It helps to get better discoverability and functional efficiency.
Hub Model

Modular design
For such big functional application, using a cards based interface would help to gain modularity in the design.

Reducing cognitive load
This app is going to have loads of info/action/decision making. Avoiding visual clutter, better legible typography, use iconography, intuitive UI etc. will help to reduce user’s cognitive load.

A minimalistic approach is a must.. Avoid excessive elements, imagery, design flourishes, or layouts that don’t add value and don’t help user to achieve the goal.
Less is more

Graphical representation
The app is going to have many analysing features and values to represent the status. Charts, illustrations, and images are to be used to make the info consumption easy.

Color code
Meaningful colour shades for representing the info are needed.
Information Architecture
A ton of features /functions/actions were to be composed against different task flows and use cases. I started with first simplifying the information by grouping and structuring them in a hierarchy.

Wireframes
The detailed wireframes were prepared for different use-cases under each module. Here, we have some of them from the productivity module.

Final Design
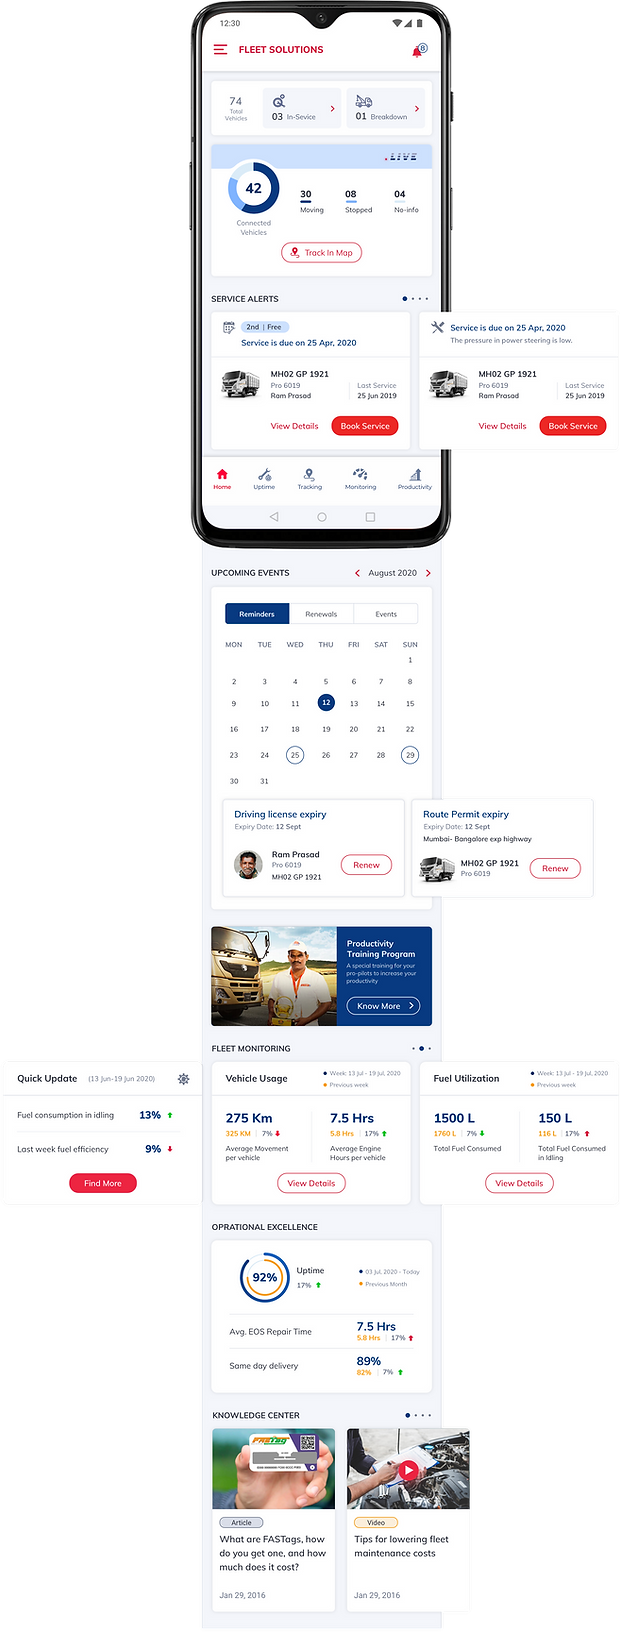
Landing screen as a hub
Landing screen is designed to have glimpses of all important info (first level) regarding each module/feature of the app and it navigates quickly to the details of the desired one.
Step-by-step vehicle tracking
Fleet managers can track any of the connected vehicles over a map and can zoom over a vehicle to get further details with important parameters. Also, can see the critical incidents by playing the recorded route in a selected time frame.
Score system for productivity improvement
This dashboard is to be synced with a physical training program with drivers. It is designed to provide a broader and then detailed view on the driver’s scoreboard.

Incidents Dashboard (telematics monitoring)
Graphical view of critical incidents is given to analyse the performance of overall and individual vehicles. Most of the parameters are provided with percentages change from the previous duration selected.

Vehicle icons for tracking on map

Vehicle avatars
Designed vehicle avatars - the image of vehicle type for easy identification
In general practice, fleet managing teams recognise the vehicle through the last 4 digits of registration number with the type of vehicle.

Breakdown reporting

My roles
I led the project and for this I was supported by a team of Interaction designer & visual Designer.
I worked closely with the product managers form client’s team and the development partners.
I was quite hands-on in creating overarching concepts, conducting workshops to ideate solutions, creating high fidelity wireframes and validating them, getting user insights, restructuring the IA and many more design outcomes including establishment of visual communication & design.
Thank you for your time.